
How-to
Compare both teams’ maps and use veto advice
Use the free Map veto panel and the team map chart during the veto, and learn when to overrule the suggestion.
What you get during the veto
FACEIT Extender shows a Map veto panel, ban and pick tags and a map chart in the match room, so you can check sample sizes and veto with data without spending an AI token.
While maps are still being banned, the match room can show three free map tools. None of them use an AI token.
- The Map veto panel: every remaining map as a you-versus-them bar, with suggested ban and pick tags.
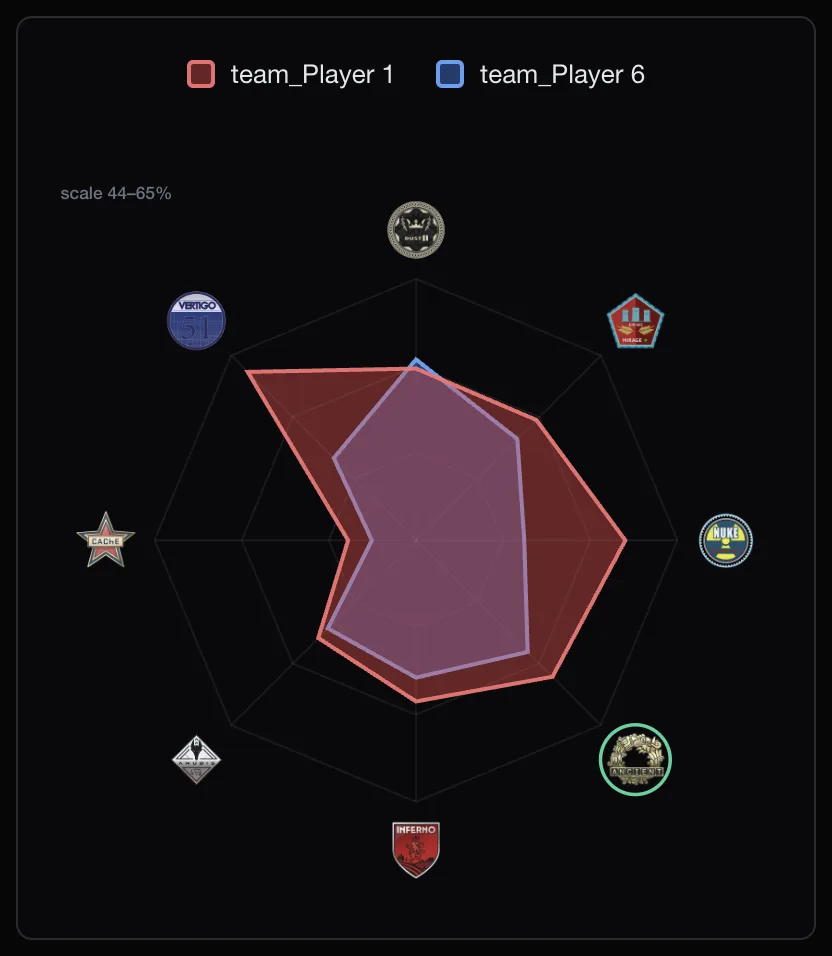
- The map chart: a spider chart of both teams’ win rates across the map pool.
- The Map stats button: per-map numbers on each player card.
The advice is advisory. You still make the veto click yourself.
Read the Map veto panel
Each row is a map. Your team’s win rate is on the left, theirs on the right, and a thin bar shows who is stronger. Spectators see Team 1 and Team 2 instead of You and Them.
- A BAN tag marks the map where you are weakest compared with the enemy.
- A PICK tag marks the map where you are strongest.
- An arrow appears when the gap between the teams is more than a few points.
- Faded rows have a thin sample. Treat them as a hint.
Hover or focus a row to see the detail, for example “55% over 24 games” or “too few games”. If there is not enough history the panel says “Not enough map history to call a ban yet.”
A veto routine
- Set the Period selector to something recent, such as Month or Last 30 Matches.
- Open the panel and note the suggested ban and pick.
- Hover any suggested map and check the number of games. Few games means less trust.
- Switch on the Map stats button to see which players carry or hurt your team on that map.
- Make the call yourself. Overrule the advice if your team has agreed to practise a map.
The map chart
The chart plots each team across the map pool. A larger shape on a map means a higher combined win rate there. The scale label in the corner shows the range so small gaps do not look bigger than they are.
If the spider shape is hard to read, click the Map chart button to switch to bars. The toolbar guide covers the buttons.
Common mistakes
- Trusting a faded row. A map with only a handful of games behind it can swing from great to poor in one match.
- Reading the chart without the scale label. A small gap can look big when the scale is narrow.
- Comparing an old period with a new roster. If a player joined recently, a short period is more honest than a year.
- Forgetting that the panel compares you with them. Hovering shows each side’s numbers separately.
After the map is picked
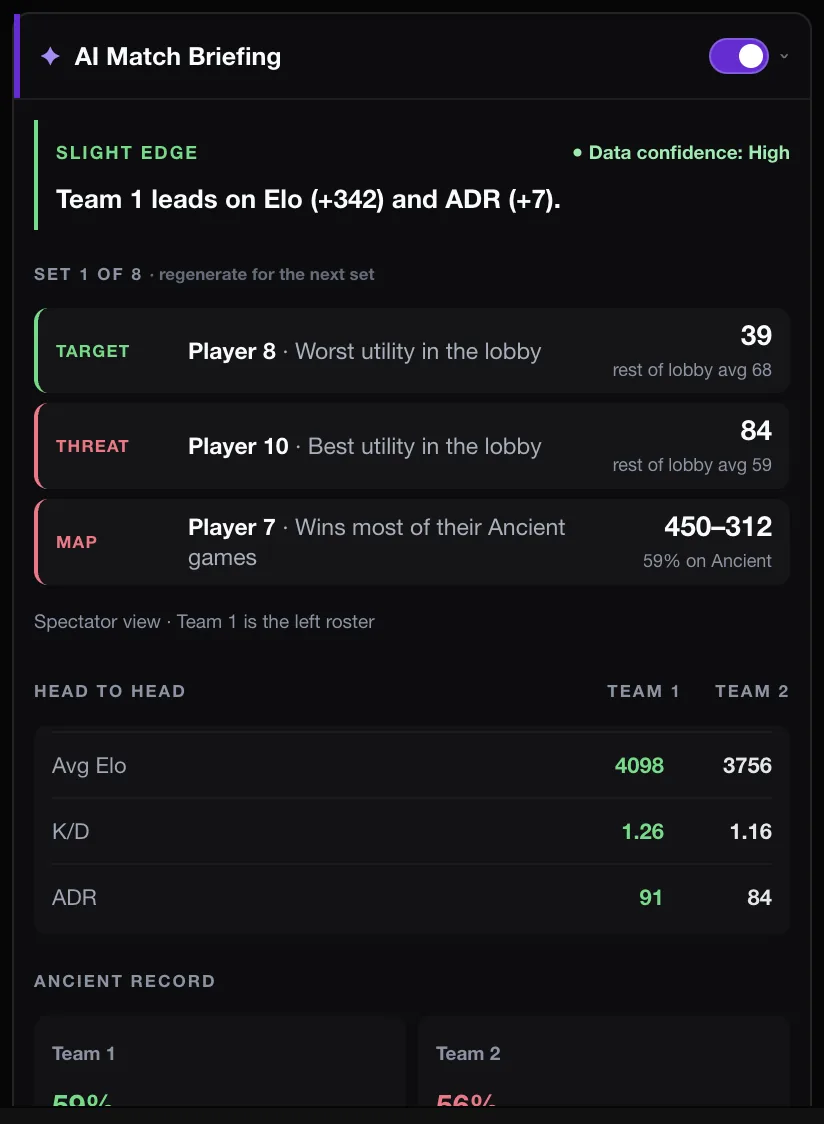
Once the map is picked, the same panel becomes the AI Match Briefing, which includes each team’s record on the picked map. See how to build and read it.
For the thinking behind the numbers, read map stats and the veto. The map stats section of the features page has a short summary, and the download page has the extension.
Related guides
FACEIT Extender is free for Chrome and Firefox: download it or read what it is and does.
Frequently asked questions
- Does veto advice cost tokens?
- No. It is calculated in the extension and is always free.
- Why is there no suggestion for some maps?
- A map needs enough games from both sides before the advice calls it. Thin samples are faded or skipped.
- Does the panel ban for me?
- No. The optional auto-veto setting is separate and is covered in the auto-veto guide.
Comments
Comments load in your browser.